Dairy Farm Guide
to Solar PV (Panels)
Installing Solar Panels (“solar”) can save money, add resilience, cut carbon and hedge future power price risk
Solar operates reliably with no effort and minimal maintenance/parts replacement for an expected life of 25-30 years
Decisions on sizing, design and supporting operational choices significantly impacts your payback
At a glance
What is the cost and payback? This depends on the right size for your farm. The tables provide an indication.
Can I be more resilient? Yes, with specific design and when there is enough sun.
What do I need to ask? How they size/ design so you mostly use your own solar power.
Will this affect my workload? Very little. Solar is handsfree for its 25-30 years apart from periodic cleaning of panels, grass/ weed control and c. year 10-15 inverter replacement. You may change timing of some work/plant running to use more of your power.
Rooftop or ground mount? Arrays can go on a roof or framed in a paddock (ground mount). Roof arrays tend to suit smaller needs and may generate less as the roof direction or pitch may not be ideal but can cost less.
Can I save by doing work myself? For ground mounts this is possible and can significantly reduce your payback time (as little as 4-5 years with load shifting and good sizing). Talk with different suppliers about how much you can do with their solution.
What are the finance options? For some banks solar qualifies for their “green” loan discounts. Most installers have a pre-approved credit option. Pay as you generate (e.g. a simple cents/kWh rate) are possible as Power Purchase Agreements (PPAs) but would likely need several farmers to work with one supplier.
Where do I find a supplier? SEANZ is the industry trade association and manages standards. Look for a member at www.seanz.org.nz. Local businesses that have installed on farm or at scale include Farmgen, Solar One and Taranaki Solar. Many national suppliers compete for larger systems.
What size, cost and payback?
Illustrative examples of size, cost and payback (supplier doing all the work; farms using timers to shift electricity use to use more solar)
Herd size/system | Size kWp | Cost $000s | Savings life $000s | Payback Year |
|---|---|---|---|---|
200/ 3.5 | 20 | $50 | $5.3 | 9 |
400/ 3.5 | 40 | $100 | $10.7 | 9 |
300/ 2.5 | 80 | $200 | $16.9 | 11 |
600/ 3 | 80 | $200 | $36.8 | 5 |
Big may not be best. With bigger systems, the relative savings fall as more solar is exported for lower value delaying payback. The table below illustrates saving/day on an example 650 herd farm for its peak production day with no new changes to when power is used.
Solar Size | Generation Capacity | Daily Energy Cost @ Peak Production |
|---|---|---|
No Solar | $106 | |
20M x 10M panels | 40kWp | $69 |
30M x 10M panels | 60kWp | $54 |
40M x 10M panels | 80kWp | $40 |
With changes to when power is used, a 60kW system at this farm would reduce the peak month bill to $11/day.
The average daily saving is significantly lower. A 28c/kWh retail cost of power and 17c kWh sell rate is used.
This guide is to help you check what your suppliers should talk to you about
Things to know | What you need from your supplier | |
|---|---|---|
Solar produces lots more energy in summer than winter so it is helpful for dairy farming. |
| |
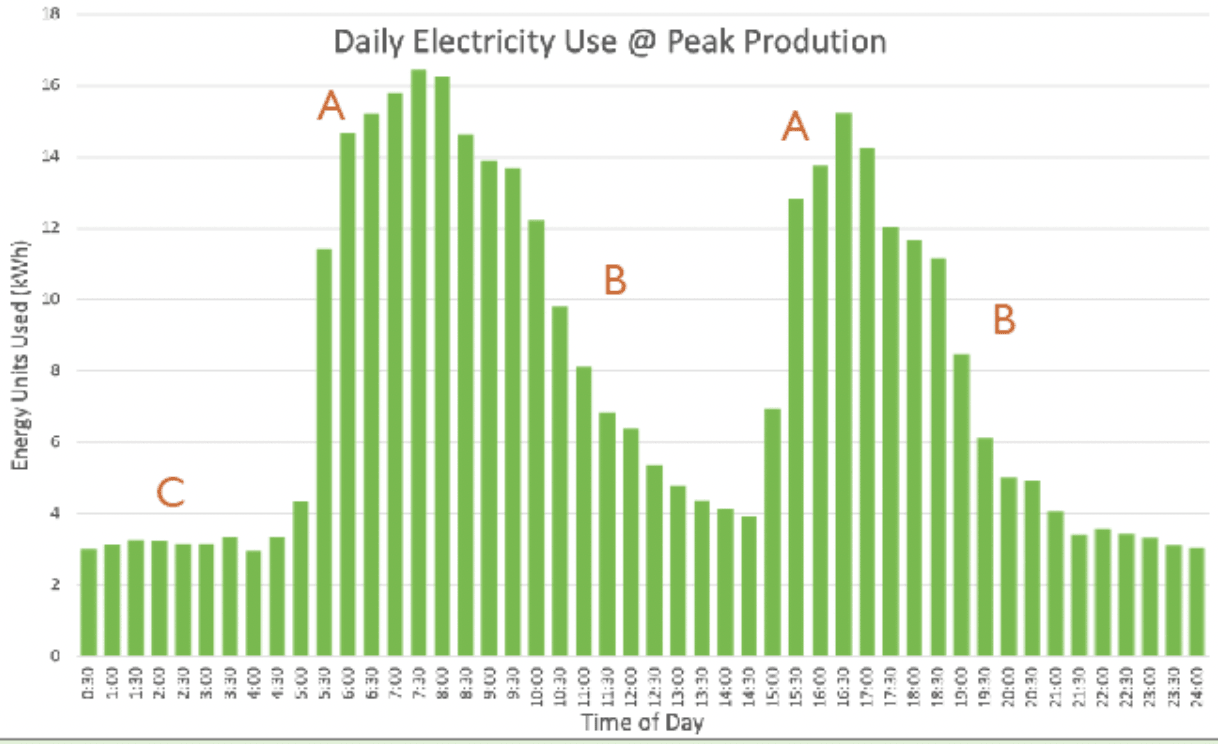
Solar generation is highest in the middle of the day (which is not mostly when we milk). See example 1. Changes to when you use power can improve payback. |
| |
Using your generated power saves on your retailer rate (e.g. c. 28c/kWh). Exporting surplus power earns less (c. 7-17c/kWh), a rate that may fall in the future. |
| |
Farm resiliency needs the right equipment to use your solar power to operate in power cuts (when the sun is shining). |
| |
Expecting to get electric vehicles (EVs) in the near future? Solar may reduce network upgrade costs. |
| |
Technical stuff – not all equipment is the same |
|
Example 1
This typical farm’s daily energy profile shows how many farms energy use peaks in morning and evening as we milk [A], chill/ pump [B] or heat water [C]). But in the middle of the day solar produces more electricity.
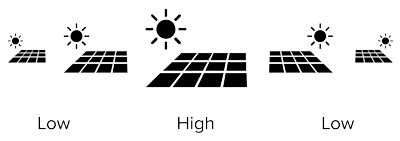
Typical solar generation
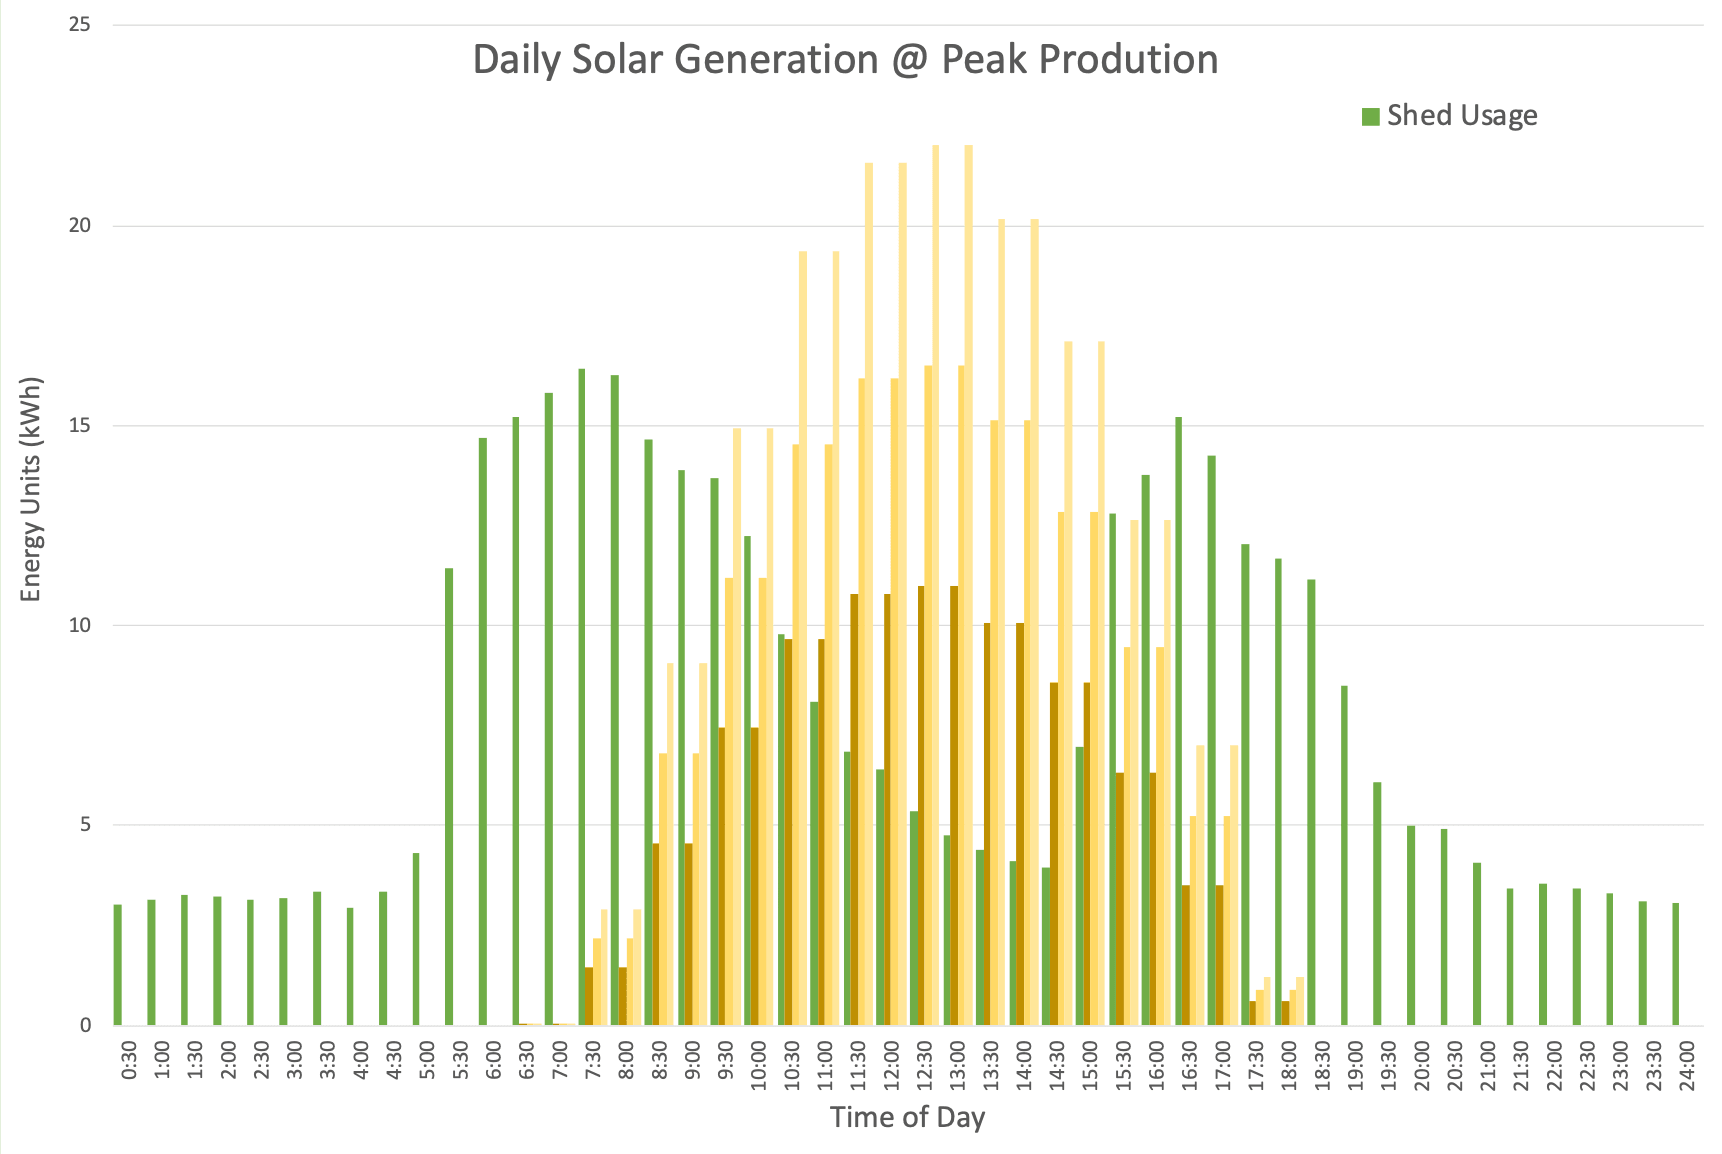
Example 2
This image shows the generation from 40 (brown), 60 (gold) and 80 (light yellow) kW PV arrays.
The high yellow generation is exported for only c. 7-17c/kWh reducing payback.
Most of the generation from the smaller array (brown) matches demand and is used, saving money at c. 28c/kWh for better payback.
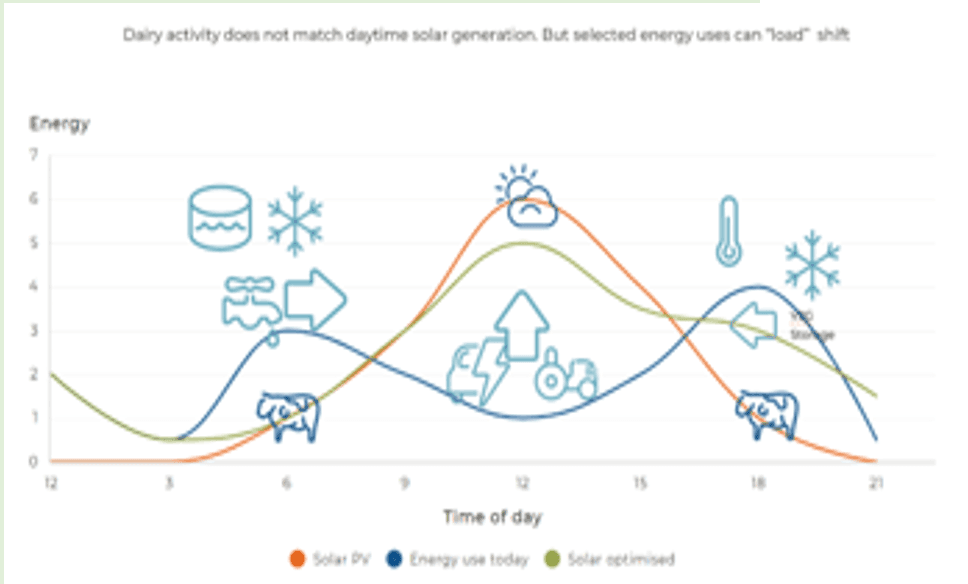
Example 3
Here we show the benefits of moving more loads in to the day so we use more of the solar generation and export less power (that reduces payback). Combined with options where you can do some of the non electrical works yourself, payback can be significantly reduced.
